
Easeason
Open-source research visualization tool exploring historical market seasonality across stocks, crypto, and indices.
- Stack
- Nuxt 4 · TypeScript · Vue · ECharts · Tailwind CSS · shadcn-vue · Yahoo Finance · Vitest
- Category
- Open Source · Research · Data Visualization
What shipped
- Server-side market-data processing, with historical OHLCV fetched from Yahoo Finance through Nitro API routes.
- { "Reusable seasonal calculations": "daily adjusted-close returns, day-of-year classification, and election-cycle grouping." }
- Interactive ECharts visualizations with animated January-to-December playback and PNG export.
- AI-readable Markdown endpoint so an LLM can consume the seasonal dataset with its surrounding context.
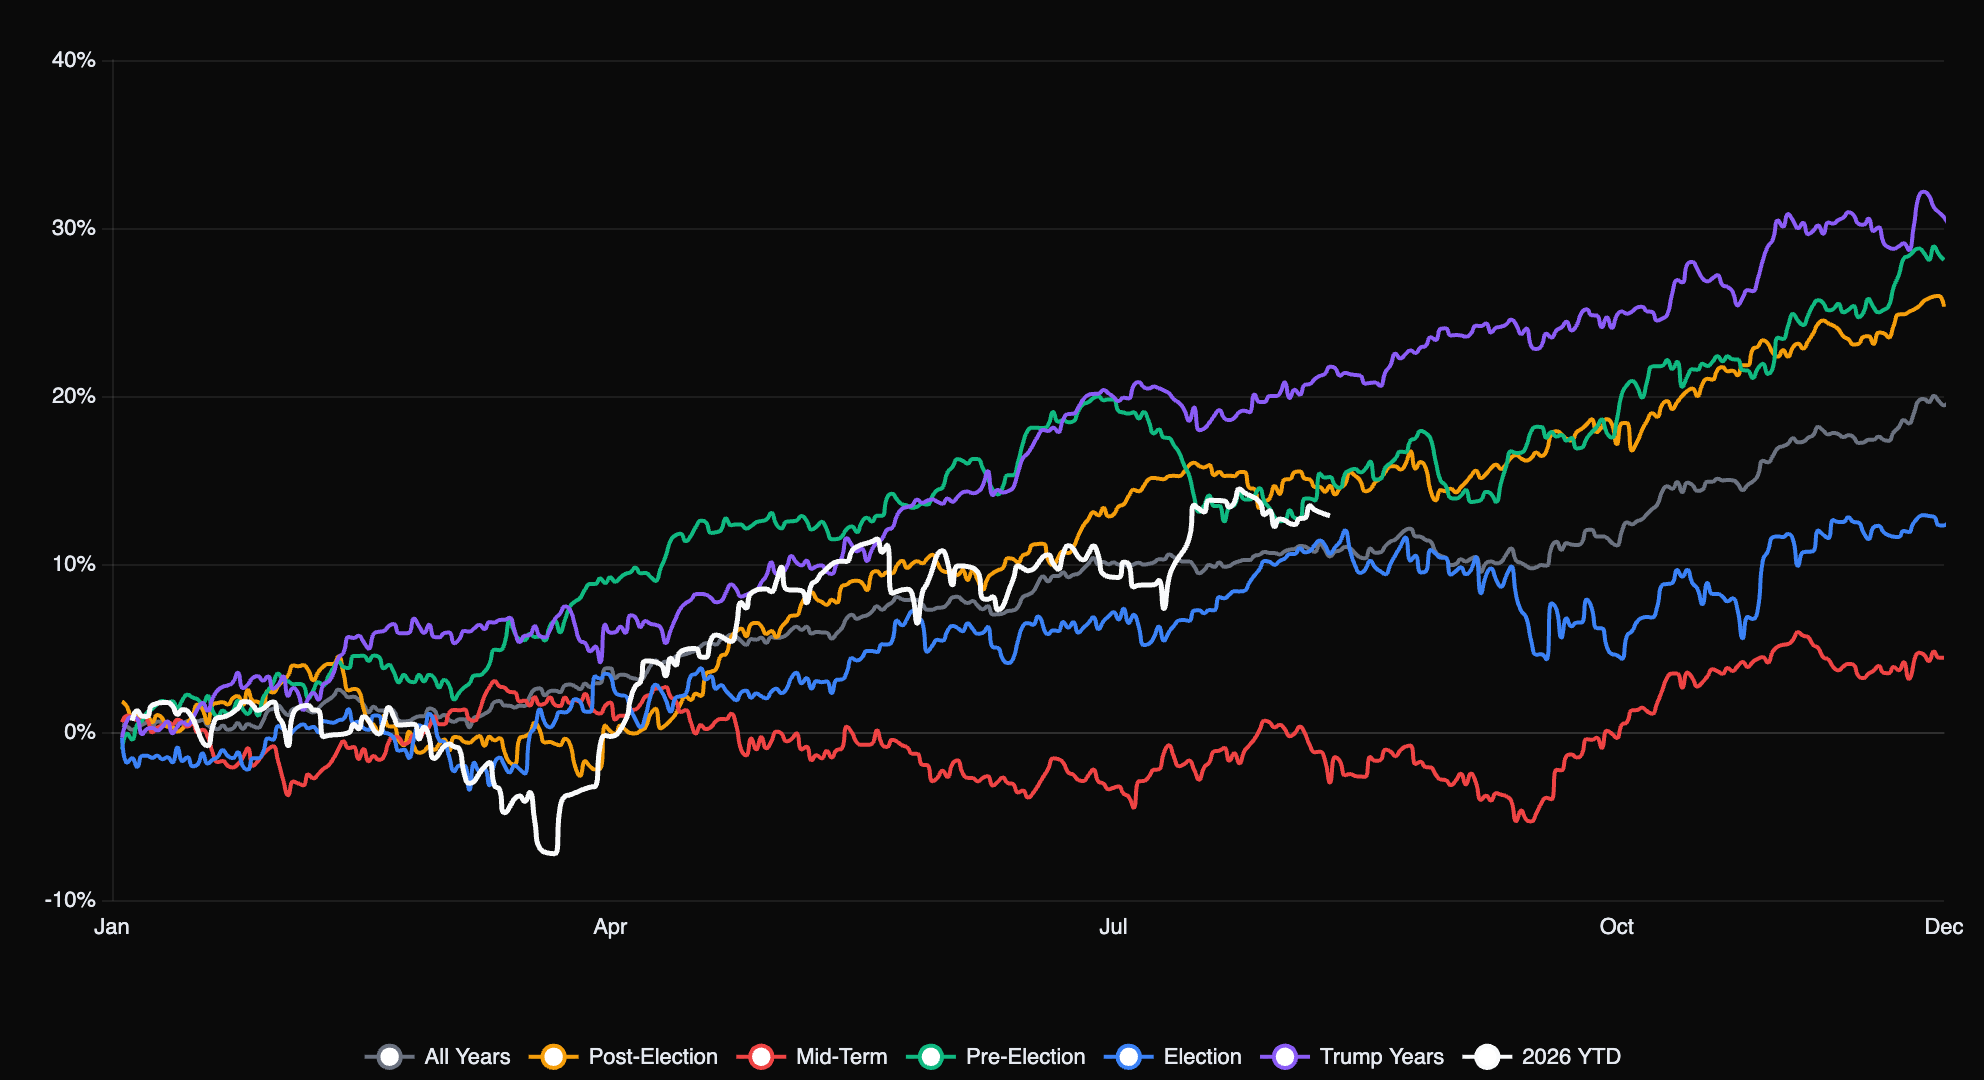
Easeason is a small open-source research visualization tool for exploring how assets have historically moved through the calendar year — across stocks, crypto, and indices, and by U.S. presidential election-cycle windows. It is a research surface, not a prediction engine: it visualizes historical patterns, and it does not claim those patterns forecast the future.
What it does
Browse a curated set of assets grouped into Crypto, US Stocks, IDX Stocks, and Indices. Open any symbol and Easeason renders a seasonal profile — cumulative return across the calendar year — for a chosen window: all years, election years, pre-election, mid-term, post-election, Trump presidency years, or the current year. Statistical summaries (average, median, standard deviation, win rate, best and worst return, year-end return) sit alongside the chart.
Engineering
Market data is the hard part. Historical OHLCV is fetched server-side from Yahoo Finance through Nitro API routes, so the browser never talks to the data provider directly. Seasonal calculations run on a daily adjusted-close return basis, classify each year into an election-cycle category, and produce the day-of-year cumulative-return series that both the chart and the export endpoints consume.
The visualization layer is ECharts: responsive, themed for dark/light mode, with animated year playback from January 1 through December 31 and speed control.
Research export
The chart exports as PNG, but the research path also includes Markdown: a per-symbol export of the seasonality context, and an AI-readable Markdown endpoint structured so a language model can consume the seasonal dataset together with its explanation.
Decisions
- Server-side data fetching. Yahoo data stays behind Nitro routes, keeping client logic focused on the dataset rather than the transport.
- Calculations as isolated, tested utilities. The seasonality math lives in server utilities under Vitest coverage, so the algorithm is auditable instead of buried in chart code.
- Markdown as an interface. Making research exportable and machine-readable extends the tool beyond a browser session.